
Whether you are feeling difficulty in maintaining efficient management or for stock controlling, a stock reporting management template is available for all.
It is updated daily and therefore prepared in excel tool. Inventory tracking template is also available here so that you can easily manage huge databases that are not otherwise possible.
Efficient stock reporting is vital for businesses to track inventory levels, monitor stock performance, and make informed decisions.
One of the most versatile tools for managing stock data is Microsoft Excel, offering numerous functions and features to create powerful daily stock reporting templates.
In this article, we explore the key components of an effective Daily Stock Reporting Template in Excel and how to build one.
Key components of an effective Daily Stock Reporting Template in Excel
Organizing the Data
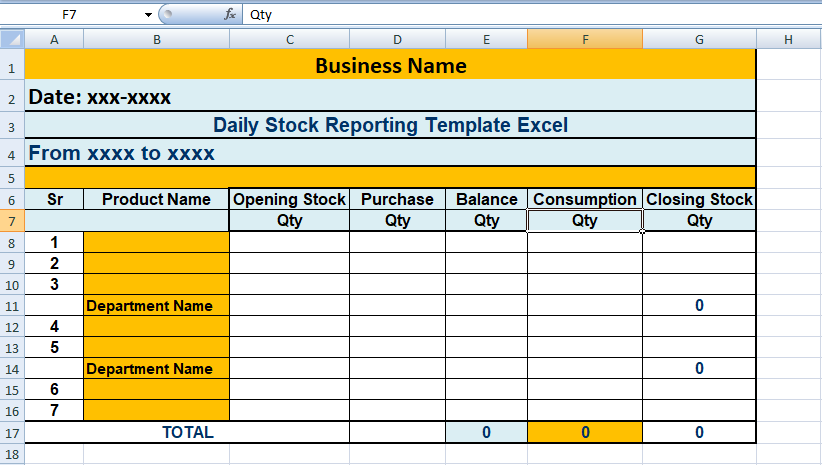
The first step in creating a Daily Stock Reporting Template is to organize the data properly. It’s essential to include relevant information such as stock names, dates, opening and closing prices, trading volume, and any other data that you consider important for your analysis.
Column headers should be clear and self-explanatory, making it easier to enter and interpret data. Moreover, using separate sheets or tabs for different stocks can help maintain a structured and organized format.
Data updation in real-time
To ensure accuracy and real-time insights, you can integrate external data sources or APIs into your Excel template. By connecting your template to live stock market data, you can automatically update stock prices, trading volumes, and other critical information as soon as the data becomes available.
Excel provides various methods, such as Web Queries or Power Query, to fetch data from the internet. This ensures that you have the most up-to-date information at your fingertips.
Calculations & formulas
Excel’s powerful formula capabilities significantly enhance your Daily Stock Reporting Template’s functionality. Some essential calculations to include are:
- Daily Price Change: Calculating the daily price change allows you to analyze the stock’s performance over time. You can use simple formulas like (Closing Price – Opening Price) or more advanced ones involving percentage changes.
- Moving Averages: Implementing moving averages (such as 50-day or 200-day) can help identify trends and potential entry/exit points for investors.
- Volume Analysis: Analyzing trading volumes provides valuable insights into the stock’s liquidity and potential price movements. You can calculate average daily volumes, compare them to historical data, or create visualizations to understand patterns better.
- Total Portfolio Value: If you are managing multiple stocks in your portfolio, adding a calculation for the total portfolio value gives you an overall snapshot of your investments’ performance.
Illustration through charts & graphs
Data visualization is crucial for quick and easy analysis. Excel offers a range of chart types, including line graphs, bar charts, and candlestick charts, which can be customized to display relevant stock data.
Creating interactive charts that update automatically as you input new data ensures a dynamic and user-friendly experience. Interactive charts provide at-a-glance insights into stock trends, historical performance, and potential correlations.
Conditional formatting
To highlight important information, utilize Excel’s conditional formatting feature. For example, set up conditional formatting rules to color-code cells based on predefined criteria. This way, you can quickly spot stocks that have experienced significant price changes or have crossed certain thresholds.
Conclusion
An Excel-based Daily Stock Reporting Template is a valuable tool for investors, traders, and businesses to monitor stock performance and make data-driven decisions. By organizing data effectively, integrating real-time updates, leveraging calculations and formulas, incorporating interactive charts, and using conditional formatting, you can create a powerful and user-friendly template tailored to your specific needs.
Remember to regularly review and update your template to ensure it remains relevant and accurate. With Excel’s versatility and customization options, you can build a comprehensive reporting tool that enhances your stock analysis and investment strategies.
Related Article: Sales Dashboard Spreadsheet Template.
Cleaning Stock Take
Various stock and inventory management templates already help project managers for the completion of their projects in time. So these Daily Stock Reporting Template Excel helps you accordingly. However, you can get professional templates at exceltemple so, you just check out this one and explore the best tool for your business success.
Hello,
How do we download documents or templates from this site?
Daily Stock Reporting template excel
Good Day
Please email me the Daily Sales Dashboard, Excel Payslip Template and an inventory template